Galton Board
Drop steel balls through brass pins and tilt the board to skew the odds.
How to play
- Tap the board to drop one steel ball. Hold your finger on it to pour a steady stream from the hopper.
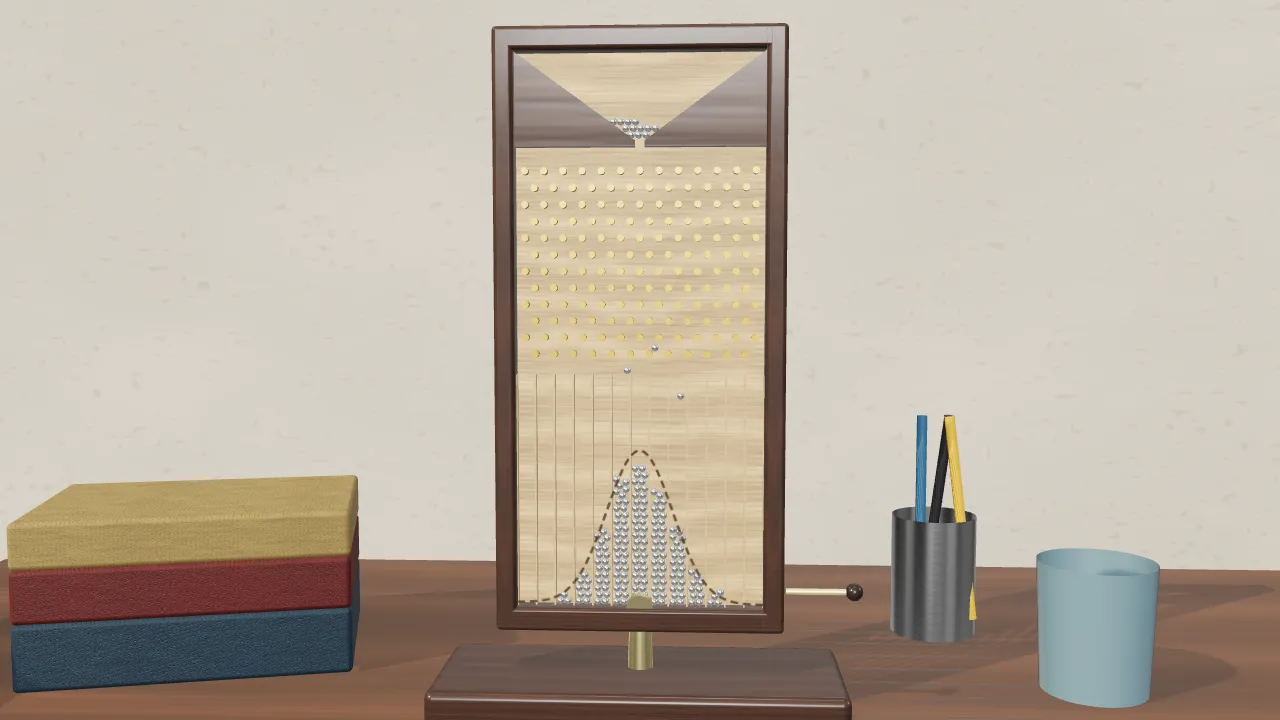
- Watch the bins at the bottom fill up. The dashed curve printed on the glass shows where a full hopper should reach on a level board.
- Drag the board sideways to tilt it on its brass pivot. Every bounce now leans one way, and the pile moves across.
- Pull the brass lever on the right to tip the balls back into the hopper. Open Lab for an exact tilt or a quick pour of 50.
Challenges
- Drop 100 balls through the pins
- On a level board, grow a bell curve with the middle bin the fullest
- Tilt the board so new balls pile up two bins to the right of centre
Try this
- Drop balls one at a time and try to predict where each will land. You can’t, yet a hundred of them always make the same shape.
- Count the balls in the middle bin and in the two outer bins. With 12 rows, the middle should collect about 23% of the balls and each outer bin only about 1 in 4,096.
- Tilt the board just a few degrees, empty the bins and pour again. A small, steady bias at every pin moves the whole curve.
Fun facts
- The board is named after the Victorian scientist Francis Galton, who described it in his 1889 book Natural Inheritance. He called it the quincunx, after the five-dot pattern of its pins.
- The number of paths to each bin is a number from Pascal’s triangle: with 12 rows, 924 of the 4,096 possible left–right sequences end in the middle bin.
- The bell-shaped normal curve appears whenever many small, independent effects add up, which is why it describes so many measurements, from heights to measurement errors.
How randomness builds a perfect curve
Each steel ball that falls into this board meets a brass pin in every row. Whether it bounces left or right depends on tiny details: exactly where it struck the pin, how it spun off the last one, a nudge from a neighbour. Nobody could predict the path of a single ball. Yet pour a few hundred through, and the bins always fill into the same smooth hill, highest in the middle and tapering away on both sides. This is the bell curve, and the board is one of the simplest ways to watch it form.
Counting the paths
Think of each row as a coin toss: left or right, with even odds. After 12 rows, a ball’s bin depends only on how many times it went right. Ending at the far left needs 12 lefts in a row, which happens in just one of the 4,096 possible sequences. The middle bin needs six of each, and there are 924 different ways to arrange that. The number of routes to each bin is a row of Pascal’s triangle, and dividing by 4,096 gives the chance of landing there: the binomial distribution.
From coin tosses to the normal curve
As the number of rows grows, the binomial distribution comes ever closer to the smooth normal distribution. Abraham de Moivre first worked this out in the 1730s, and it is a special case of the central limit theorem: add up many small, independent random effects and their total follows a bell curve, almost whatever the individual effects look like. That is why the same shape describes so many things in nature and in measurement.
Tilting the odds
Tilt the board and gravity gains a sideways part. Each bounce now leans slightly one way, so the chance of going right at every pin is a little more than one half. The curve keeps its bell shape but its peak slides across, just as the maths predicts for a biased coin.
For the curious
Nothing here is scripted. Every ball is simulated as a disc falling under gravity, bouncing off the pins with a coefficient of restitution of 0.4, losing a little speed by rubbing on the glass and touching the other balls. In a test run of 2,000 balls on a level board, the average bin came out at 6.01 and the spread at 1.74 bins, against the theoretical 6 and 1.73. With n rows and a chance p of going right at each pin, the chance of landing in bin k is
P(k) = C(n, k) · pk · (1 − p)n − k, with mean μ = np and standard deviation σ = √(np(1 − p)).
For large n this approaches the normal curve f(x) = e−(x − μ)²/2σ² / (σ√(2π)). On this level board n = 12 and p = ½, so μ = 6 and σ ≈ 1.73.
Questions people ask
What does a Galton board show?
It shows how many random left-or-right bounces add up to a predictable pattern. Each ball’s path is unpredictable, but together the balls pile up into a bell-shaped binomial distribution that closely matches the normal curve.
Why do most balls land in the middle?
There are far more paths to the middle than to the edges. With 12 rows of pins, 924 of the 4,096 possible sequences of bounces end in the middle bin, but only one sequence reaches each outer bin.
What happens if you tilt a Galton board?
Gravity pulls the balls slightly sideways, so each pin is more likely to send them one way. The curve keeps its bell shape but shifts towards the lower side, like flipping a biased coin many times.